WebGIS
WebGIS development and implementation by Roberto Maria Rossi, University of Padova
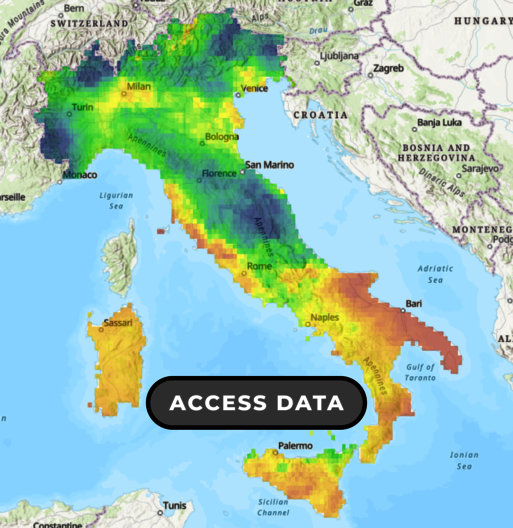
Maps of extreme precipitation quantiles over Italy for 1-hour and daily durations, derived using multiple statistical approaches and precipitation datasets.
For the 1-hour duration, extreme precipitation quantiles (mm/h) are obtained using the Generalised Extreme Value (GEV) distribution (Von Mises, 1936) and the SMEV approach (Marra et al, 2019; 2020). Results are obtained from three satellite (CMORPH, IMERG, GSMAP) and on reanalysis (ERA5) datasets and subsequently corrected using the national rain gauge dataset collected within the INTENSE project following the method proposed by Marra et al., 2022 (without the dependence of the biases on the elevation). Extreme quantiles are estimated for four different return periods (10, 50, 100, and 200 years). The analysis covers the period 2001-2024.
For the daily duration, extreme precipitation quantiles (mm/day) are estimated using three different approaches: i) the Generalized Extreme Value distribution (GEV) (Von Mises, 1936), ii) the Metastatistical Extreme Value Distribution (MEVD - native scale) (Zorzetto and Marani 2016), iii) Metastatistical Extreme Value Distribution (MEVD - point scale) (Zorzetto and Marani, 2018) applying a spatial downscaling method to extreme-value statistics, grounded in the theory of random fields. The results are derived from IMERG remote sensing precipitation dataset and reanalysis product (ERA5). For the GEV and MEVD native-scale approaches, datasets are analyzed at their original spatial resolutions (10, 25, 10, 10, 5, and 25 km), while results from the point-scale MEVD approach are represented at the point scale. Extreme quantiles are estimated for four different return periods (10, 50, 100, and 200 years). The analysis covers the period January 2002 - December 2023.
SRT (1, 3, 6, 12, 24 hours): Surface Rainfall Total at 1, 3, 6, 12, and 24-hour intervals for the 30 September 2022 event, observed by the X-band meteorological mini-radar installed at Poggio San Francesco (Palermo), after residual ground-clutter removal, signal attenuation correction, and integration with ground-based measurements from the rain gauge network managed by the HYCLIC group of the Department of Engineering
Maps of critical water content thresholds, in terms of Critical Soil Moisture (CSM) and Critical Wetness Index (CWI), evaluated at 0.75, 1.00, 1.50 and 2.00 m. CSM represents conditions of unsaturated soils, whereas CWI refers to groundwater-controlled conditions.
Maps of the factor of change in failure occurrence induced by climate change scenarios for the RCP4.5 and RCP8.5 (Representative Concentration Pathways) scenarios and the 2050 time horizon. The maps quantify the variation in the estimated occurrence of failures with respect to the current climate scenario.